An example posted to our old forum by user josephbradley26. He wrote:
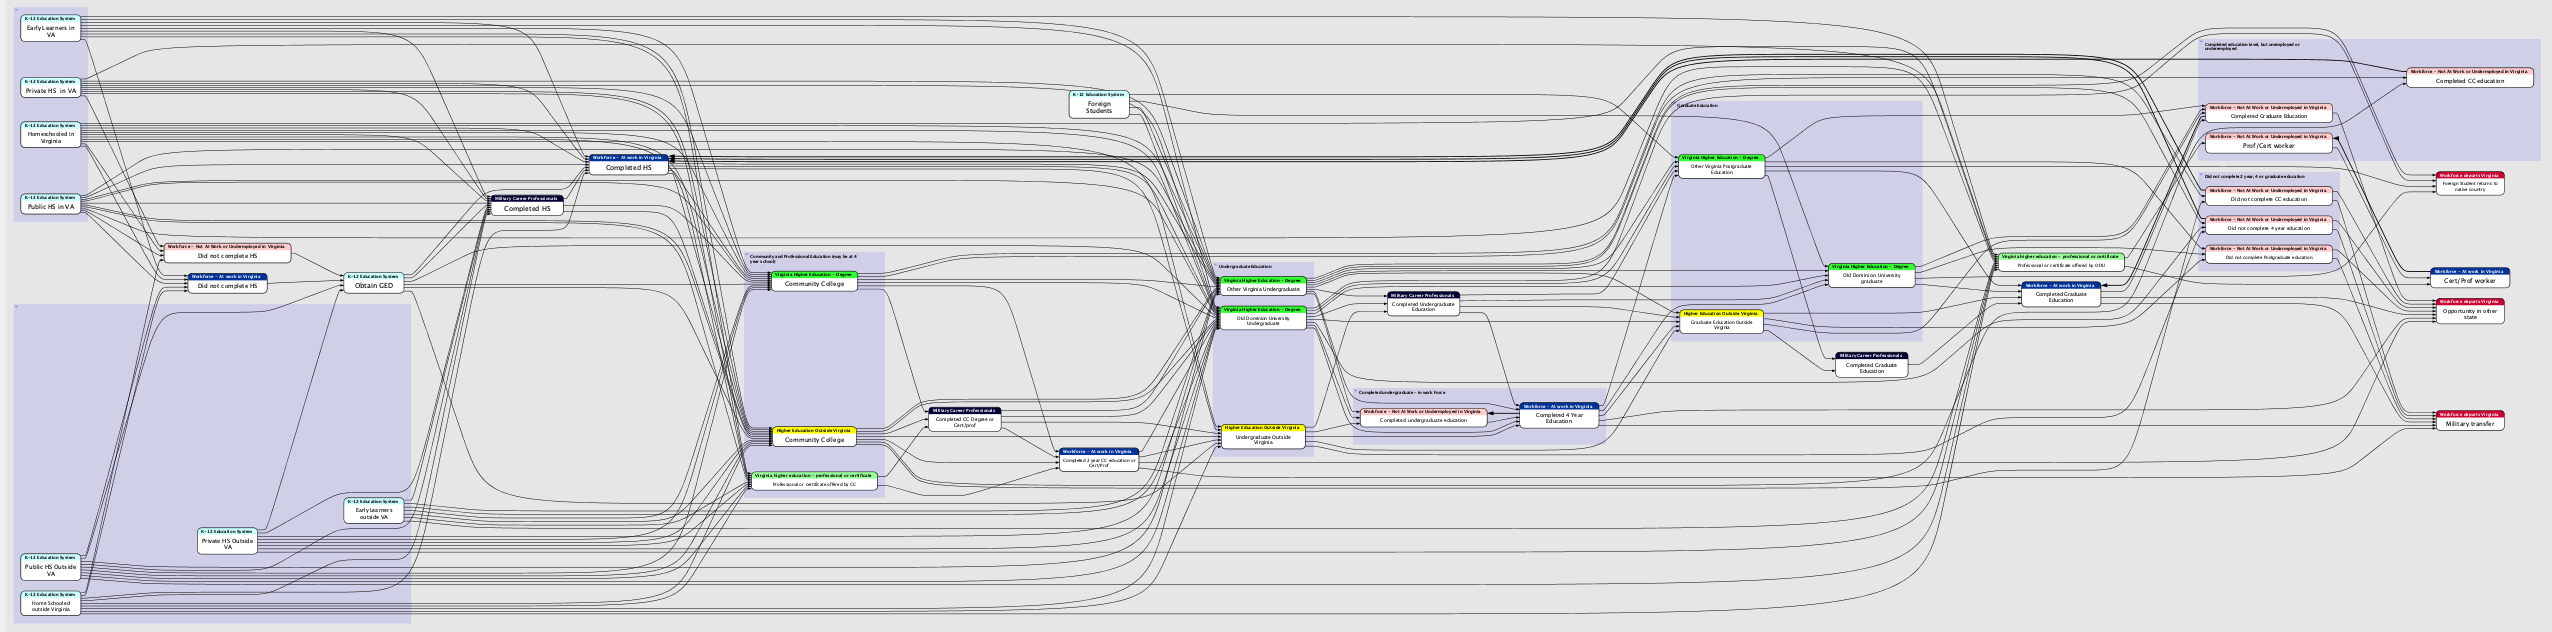
Governor McDonnell challenged Virginia educators to find ways to increase stem graduate by 100,000 over 15 years without significant resource increases. To start my thinking off, I created a map depicting where students came from, where they were educated and how they were either lost from the system or graduated.
This map then served to identify a lot more questions to be asked.
In this picture, the flows represent “states” for a student, harkening back to the concept of state spaces in design of control systems.
One can then represent the flows in a Markov Chain, or other analytical tool (Systems Dynamics) and model the populations.
The state (Virginia) actually has a fair amount of data that would enable creating a model.
Then, you can postulate policy changes and the resulting changes in flows/pools, to see what the bang for the buck is.Longer term, you could assess the benefits of an actual policy change, and increase those that truly work and kill those that do not.
Continued tracking would enable you to determine the knee or rolloff point where the policy gain reaches diminishing returns.I used a mind map to track the questions (and potential answers).
In this case, sponsorship did not come available and this effort died. However, as you note the picture is quite evocative and I saved it as a concept for future efforts.
In the Governors Challenge for STEM map, the arrows mean “A” transitions to “B”
Governor EO9 Rev5.xlogic (169.0 KB)